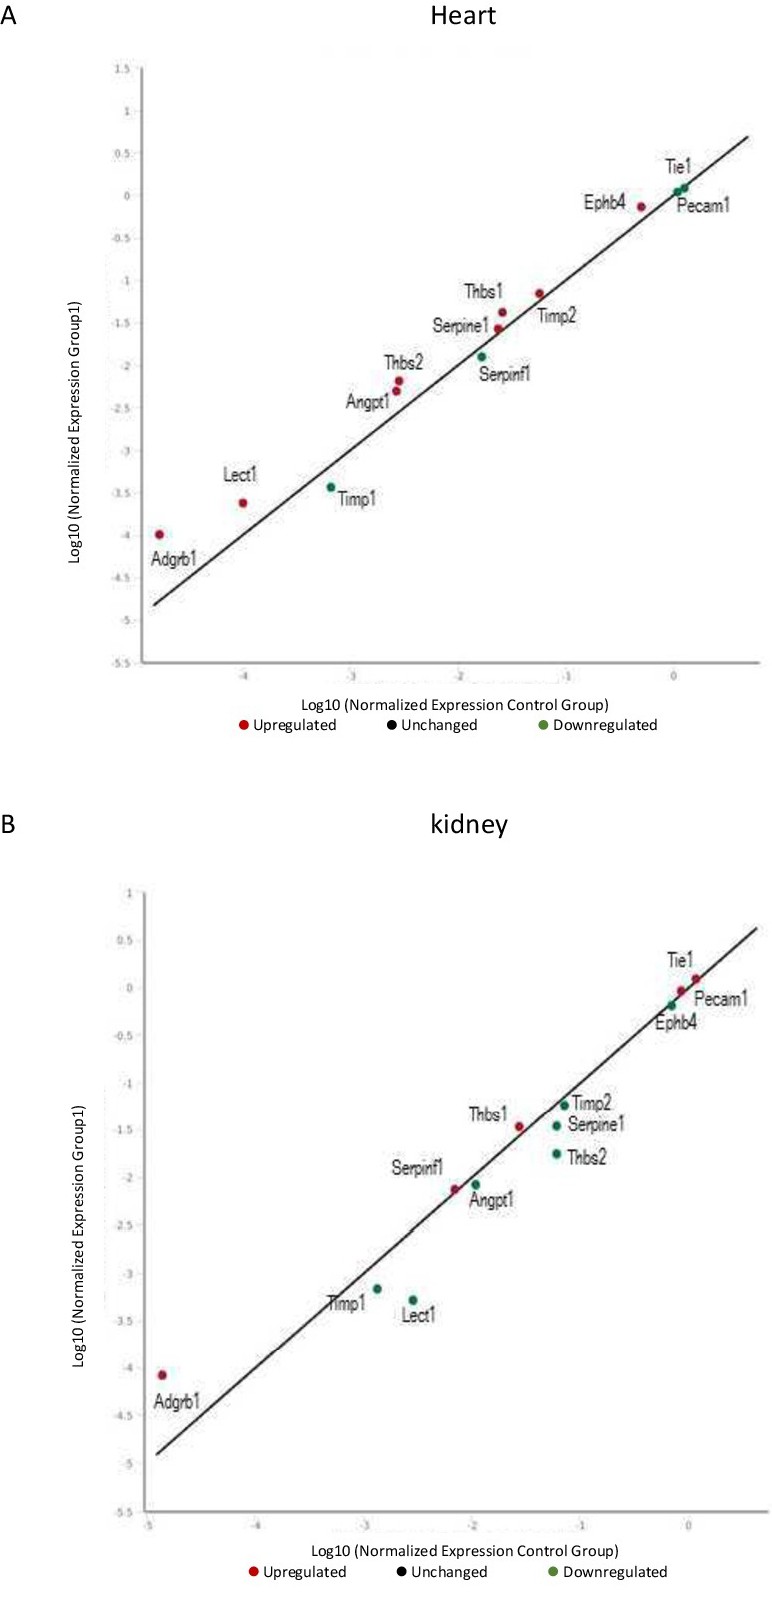
Fig. 3. The antiangiogenic gene expression profile analysis in heart (A) and kidney (B) of control and T1DM animals. Values represent fold change of STZ-treated vs control animals. Red spots are upregulated genes; Green spots are downregulated genes.